Credit Risk and Asset Visibility
Overview
Credora’s platform enables real-time credit analytics that can be used for credit underwriting and risk monitoring. This paper focuses on digital asset trading firms, a subset of Credora users.
Borrowers connect accounts to Credora’s privacy-preserving architecture, allowing for real-time calculations of asset values and risk information. The privacy-preserving architecture ensures sensitive information, including positions and trades, are inaccessible by Credora or any other party.
Credora credit assessment methodologies utilize visibility metrics. For digital asset trading firms, these are defined as the calculated asset balance divided by the most recently reported current assets via financial statement submissions.
Lenders have the opportunity to monitor borrower real-time risk metrics during active loans, permitting a superior understanding of the credit risk absorbed by the borrower (typically to exchanges), and providing a proxy for how the balance sheet is evolving between financial reporting periods.
Due to the nature of borrower activities, and the wide range of trading venues for quantitative trading firms, 100% visibility for any specific trading firm is challenging. In Credora’s credit models, visibility is incrementally assigned points along a curve.
Although complete visibility is desirable, partial visibility significantly reduces risk for lenders. The value of visibility can be characterized as follows:
- Financial Statement Proxy: Visibility provides current information, in contrast to the historical snapshots typically relied upon for credit analysis. For example, balance sheets are typically delivered 15–30 days after the snapshot date. Furthermore, many firms report financial information on a quarterly basis.
- Venue Risk: Visibility provides incremental information on counterparty risk, by identifying the location of assets. This is especially relevant in digital asset trading.
- Risk Information: Credora identifies major changes in borrower position risk, which may signify strategy drift away from communicated risk parameters.
This post is focuses on visibility as a Financial Statement Proxy. The statistical exercise underpinning it aims to quantitatively demonstrate the relationship between visible assets and reported current assets. It concludes that even partial visible assets are a strong predictor of subsequently reported balance sheet current assets.
Dataset
Credora’s years of operation have allowed us to collect a unique dataset that combines risk monitoring information and reported financials. The time period considered was January 2021 through July 2023.

Measurements in absolute figures for asset values give the raw relationship between the two series (visible vs reported). To remove the effect of upward or downward trend over time from absolute values in the signals, the analysis below is produced both in absolute figures, and looking at log differences (i.e. we evaluate the monthly change). Relative measurements are interesting to evaluate the percentage changes or growth rates between two series.
- X = ln(X[t]/X[t-1]) (Visible Assets)
- Y = ln(Y[t]/Y[t-1]) (Reported Current Assets)
Pearson Correlation
First we calculate the correlation coefficient between “Visible Assets” and “Reported Current Assets”. The most common correlation coefficient is the Pearson correlation coefficient, which is widely used for numerical features, including time series.
Performing a statistical test, such as t-test, alongside calculating the correlation coefficient helps determine whether the observed correlation is significant or likely due to random chance, accounting for factors like sample size and hypothesis testing. The formulated null hypothesis (H0) and an alternative hypothesis (H1) are:
- H0: There is no correlation between visible assets and current assets (correlation coefficient = 0).
- H1: There is a correlation between visible assets and current assets (correlation coefficient ≠ 0).
- Significance Level: A significance level of α = 0.05 was chosen for the hypothesis test.
Absolute Figures
Results show a pearson correlation coefficient of 94.5%, indicating a strong linear relationship. The p-value obtained for the significance of correlation was p < 0.001, significantly below the chosen significance level. Therefore, we reject the null hypothesis, meaning that there is a significant correlation between visible assets and current assets.
Correlation in absolute figures measures the precise linear relationship between variables and helps to understand the absolute impact of one signal on another.
The scatter plot with “visible assets” on one axis and “current assets” on the other helps to visualize the relationship between the two variables and provide insights into the degree of correlation. Colors correspond to individual borrowers in different observation points.
Logspace Ratio
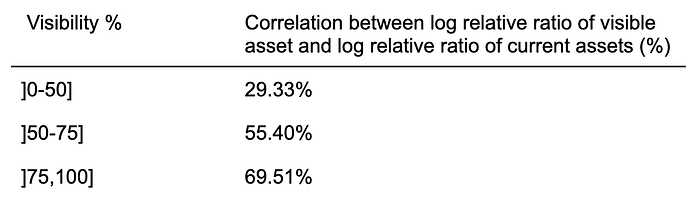
In the log space, the obtained correlation depends highly on the percentage of visible assets. By looking at the correlation calculated per visibility percentage of the borrower, it is clear that correlation between visible and reported assets increases with the increase in visibility percentage.
This makes intuitive sense, as it is more difficult to infer the borrower’s total asset balance change if visibility is low.
For that reason, the statistical test and pearson correlation are calculated for borrowers with a visibility percentage higher than 20%, under the same hypothesis testing.
Results show a pearson correlation coefficient of 66.68%, indicating a strong linear relationship. The p-value obtained for the significance of correlation was p < 0.001, significantly below the chosen significance level. Therefore, we reject the null hypothesis, meaning that there is a significant correlation between visible assets and current assets.
The scatter plot with “Log Rel Diff” from current assets and visible assets helps to visualize the relationship between the two variables and provide insights into the degree of correlation. Colors correspond to individual borrowers in different observation points.
Robust linear regression
Modeling the relationship between the two variables, allows us to predict the “current reported assets” variable (the dependent variable) based on the values of “visible assets” (the independent variable).
Using robust regression with a Huber loss function for signal similarity measurement offers advantages in scenarios where the data might have outliers or is affected by noise. This linear regression, calculated in both absolute and relative figures, helps to baseline the potential of the visible assets variable as a predictor, using just a simple linear regression.
Absolute Figures
As below table shows, the coefficient for the variable X is 2.0602. Since the p-value associated with the Wald test for the corresponding to variable X is very close to zero (P>|z| ≈ 0.000), it suggests that the variable X is statistically significant in explaining the variation in Y.
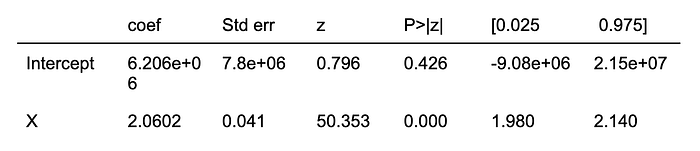
Residuals are the differences between the observed Y values and the predicted Y values from the model. According to the below plot, variance is equally distributed and shows that linear relationship between variables is valid.
Logspace Ratio
We observe a statistically significant relationship between the two signals represented by variables X and Y. The coefficient for X (0.2491) indicates that for every one-unit increase in X, Y is expected to increase by approximately 0.2491 units.
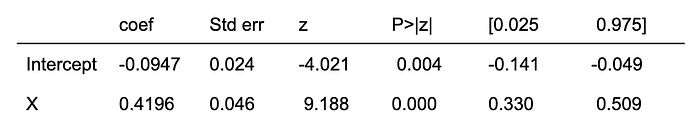
Given that the p-values associated with both the intercept and the X coefficient are very low, it’s very likely that the relationship is not due to random chance.
As before, the residuals show a normal distribution:
Conclusions
As detailed above, visible assets show strong Pearson correlation results for both absolute (94.5%) and relative log scale figures (66.6%) when considering only borrowers with >20% visibility, passing the statistical tests that suggest the observed correlation is significant. The robust linear regression model shows a significant linear relationship between the two signals.
The implications for credit analysis as applied to trading firms is powerful. Monitoring of assets provides a valuable proxy for financial statement changes, even where visibility is materially below 100%.
From a risk management perspective, this indicates the incremental value of enabling real-time monitoring on borrowers, especially where privacy-preserving technology can eliminate data sensitivity concerns and increase the visibility percentage further.
At Credora, our core mission is to facilitate more efficient credit markets. In the current paradigm of financial statement reporting, real-time data offers a huge opportunity.